- Albanian
- Arabic
- Belarusian
- Bengali
- Czech
- English
- French
- German
- Hebrew
- Hungarian
- Indonesian
- irish
- Italian
- Japanese
- kazakh
- Persian
- Russian
- Thai
- Uzbek
- Vietnamese
Exploring the Dynamics of Roller Coaster Path Equations and Their Visual Representations
Understanding Roller Coaster Graph Equations
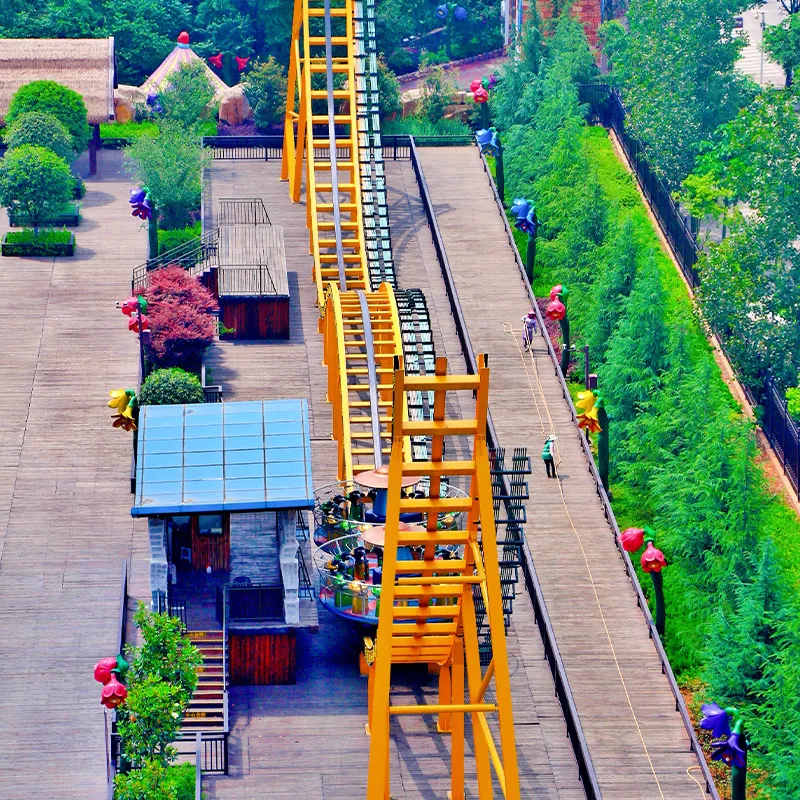
Roller coasters are exhilarating attractions that combine physics, engineering, and mathematics to deliver thrilling experiences. At the heart of these amusement park rides lies a complex design process that can often be represented through mathematical equations and graphs. Understanding roller coaster graph equations involves delving into concepts of velocity, acceleration, and the forces acting on riders as they navigate through steep drops, sharp turns, and inversions.
One primary aspect of roller coaster design is the relationship between height and speed. According to the principles of physics, when a coaster ascends to a higher position, it stores gravitational potential energy. As it descends, this potential energy transforms into kinetic energy, accelerating the ride. The roller coaster graph can illustrate this change visually, with the vertical axis representing height and the horizontal axis representing distance traveled along the track.
A basic description of a roller coaster's height can be modeled with a function, such as a quadratic equation. For instance, a parabolic curve might depict the ascent to a peak, followed by a steep decline. The equation, h(x) = -ax^2 + b, captures the rise and fall of the coaster. Here, h represents height, x stands for the horizontal distance, and a and b are constants that define the specific features of the coaster, such as its maximum height and the curvature of its drops.
roller coaster graph equations

Additionally, the speed of the coaster can be analyzed using the concept of derivatives. The first derivative of the height function gives the velocity of the coaster. When the coaster descends, the speed increases, and the graph of speed against distance will show a positive slope in those sections. Conversely, when the coaster climbs, the speed decreases. The critical points of these functions highlight where the coaster is at its fastest or slowest, allowing engineers to fine-tune the ride experience for safety and enjoyment.
Another crucial factor is acceleration, which can be derived from the velocity graph. The second derivative of the height function provides information about the coaster's acceleration. Positive acceleration indicates that the coaster is speeding up, while negative acceleration (deceleration) shows a decrease in speed. For a thrilling ride, designers aim for a balance of varying accelerations by adjusting the slopes of the track to create moments of excitement and gentler transitions.
To visualize the entire experience, it is useful to create a comprehensive graph that combines height, speed, and acceleration. This multilayered graph not only enhances understanding but also allows engineers to predict how the ride will feel to the riders. Equations governing these graphs help ensure that safety regulations are met while still providing an adventurous experience.
In conclusion, roller coaster graph equations encapsulate the intricate relationship between height, speed, and acceleration found in these thrilling rides. By applying mathematical principles, engineers can design roller coasters that delight riders while adhering to safety standards. Understanding these equations is not just an academic exercise; it's a gateway to grasping how thrilling moments are crafted in amusement parks around the world.
-
Flume Ride-Hebei Zhipao Amusement Equipment Manufacturing Co., Ltd.|Thrilling Water Attraction&Customizable DesignJul.30,2025
-
Flume Ride - Hebei Zhipao Amusement Equipment | Water Coaster, Thrilling DescentJul.30,2025
-
Flume Ride - Hebei Zhipao | Thrilling Water AttractionJul.30,2025
-
Flume Ride: Thrilling Water Attraction by Hebei Zhipao|Log Flume Manufacturers&Flume Ride DesignJul.30,2025
-
Flume Ride-Hebei Zhipao Amusement Equipment Manufacturing Co., Ltd.|Thrilling Water Coaster, Safe DesignJul.30,2025
-
Flume Ride-Hebei Zhipao Amusement Equipment Manufacturing Co., Ltd.|Thrilling Water Attraction, Safe DesignJul.30,2025
